Exercise Two focuses on the steric contacts made locally in a tripeptide of alanine. There will be an investigation of the intramolecular interactions that give rise to the "valleys" of stability in the Ramachandran Plot.
This exercise will introduce the Midas commands that permit alteration of torsion angles about specific bonds and the creation of van der Waals surfaces.
In organic chemistry, it is apparent that molecular structure is defined by the geometrical preferences of the constituent atoms. Benzene is planar because sp2 hybridized carbons are planar. Cyclohexane adopts a chair conformation, because that is the least stressful way to arrange six tetrahedral carbons connected in a ring. As we move now from these small molecules to the relatively enormous biomolecules such as proteins, it's important to remember that their structures are equally rooted in the structural preferences of their constituent parts. For simplicity's sake, in this class we will often look at the monomeric fragment of the polymer as the lowest structural denominator. In beginning to study protein structure, the logical starting point is therefore the amino acid.
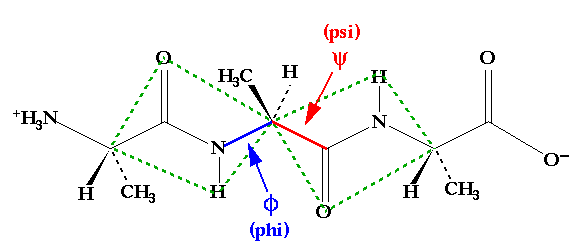
While the structures of the twenty amino acids are relatively simple and similar to one another in some key functionalities, the three dimensional structures of proteins are exceedingly complex. To understand that structure one can start with the simpler conformational restrictions placed upon the building blocks of those polymeric molecules. In particular, it is useful to consider the bonds that connect the amino acid sidechains along the backbone. In 1968, Ramachandran showed that, of the torsion angles available in those bonds that constitute the polypeptide backbone, the amide bonds connecting amino acids could be neglected given their necessarily planar structure.(1) Thus, only two backbone dihedral angles need be considered for each amino acid residue in the chain. These angles are identified as phi and psi as shown in Figure 2.1.
Figure 2.1 A tripeptide of alanine. Note that the peptide bonds on either side of the central alpha carbon act to create rigid plates which rotate about phi and psi.
In this exercise, you will investigate the rotational freedom about phi and psi using a model of the tripeptide, AlaAlaAla. The goal is to demonstrate the results of Ramachandran's work, shown in Figure 2.2. Only certain allowable values of phi and psi exist, defined roughly by the contoured areas. If you read the plot as a contour map, the regions labeled alpha and beta represent valleys of stability, surrounded by a high energy plateau. As is shown in the "Ramachandran Plot", values of phi are limited primarily to the range between -60 degrees and -150 degrees. For psi, the range is limited to regions centered about -60 degrees and +120 degrees.
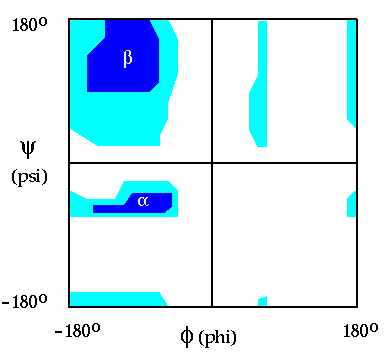
Figure 2.2 A Ramachandran plot for the tripeptide in Figure 1.1. The plot is similar to a topographical map, where energy, instead of altitude, is shown with the contours. Surrounding phi=0, psi=0 there is a high energy "plateau" which drops into valleys of stability with minima for alpha helices and beta sheet, noted in the figure. In large proteins, the large majority of non-glycine residue possesses phi, psi combinations that reside in these valleys.
The goal of this exercise is to identify the intramolecular interactions that make certain combinations of torsion angles unfavorable. Such interactions arise whenever two atoms or functional groups penetrate each other's van der Waals radii (see Appendix C for a table of values). For example, a methyl group has a radius of about 1.7 Å. If two methyl groups approach each other to within 3.5 Å, that leads to steric repulsion and an unfavorable conformation. Identification of the dihedral pairs offering stability and instability assists in explaining the preponderance of certain secondary structures, such as the alpha helix and beta sheet, in protein structure, and also predicts that some amino acid residues will adopt substantially different conformations in a polypeptide chain.
Save the file AAA.pdb in your working directory. These coordinates describe a tripeptide of three alanine residues connected by two peptide bonds. After copying the file to your own directory, the file may be viewed in Midas by typing, in the console window:
(The Midas window can be re-sized by dragging the frame with the cursor, using the left mouse button, or by clicking on the "full screen" box in the upper right corner of the frame.) The amino acid residues are numbered in sequence from 1 to 3. You will be manipulating phi and psi for Ala2, since only that residue, of the three, is bounded by two peptide bonds.
The model will initially appear all in white, without any shading to distinguish element type. To begin, it will be necessary to color code atoms for easier identification. To color each atom in the model by element type, simply type:
Since you will be principally concerned with Ala2, it may be useful to color the alpha carbon uniquely. Use any available color that has not been used (yellow, for example).
This command assigns that color to the alpha carbon (CA) of residue 2 in model #0 (see Exercise One or Midas online help for further information.)
In preparation for examining the allowable torsion angles in a tripeptide, set psi for Ala2 to one of the following angles: 0, 60, 120, 180,-120 or -60 degrees. To do this you will need to use the "rot(ation)" command. The simplest approach is to combine a command line entry with cursor picking. Type
Or, alternatively type "rot" and then select the four atoms, before hitting enter, using picking. Hold down the cursor and click (using the left hand mouse button) the four atoms that define the angle psi: N, CA and C on Ala2 and N on Ala3. At this point the torsion angle, reported as "rot 0" should appear at the upper left corner of the Midas window.
The angle may then be manipulated by activating the directional buttons corresponding to "bondrot 0" in the Midas Control Panel with the cursor, using the left hand mouse button.
When you have obtained the correct angle, type:
and the change will be made permanent. If you should fix the wrong value, you may restart the process. To reset to the original angle at any time, type:
The next step will be to vary phi and monitor any bad interactions that may arise from rotations about the N-CA bond. For this particular exercise, you will follow the distances between three pairs of atoms:
To determine these distances you will need to invoke the dist(ance) command three separate times:
Use "picking" to select the pairs of atoms listed above. You may wish to refer to the list of atomic and functional group radii in Appendix C.
Now prepare to rotate phi for Ala2 and inspect the conformation of the tripeptide at all of the following phi values: 0, 60, 120, 180,-120 and -60 degrees. For each value you will need to examine the model for "bad" contacts by monitoring the distances listed above.
To do this, assign a rotation as done previously for the psi angle, this time for the torsion angle between N and CA of Ala2. Then start to vary it, using the appropriate slider, between the values listed above. The previous commands can be reapplied here, with the necessary modifications. Does the Ramachandran plot accurately reflect the interactions seen when psi is varied? What would the plot look like (qualitatively) if the alanine residues were replaced by glycines?
The methods described above are a good quantitative method for observing steric conflicts, but there are effective ways to observe those conflicts visually using a van der Waals surface. For example, one could monitor the interaction between the carbonyl oxygens of residues 1 and 2 by creating the vdW surfaces for the two atoms:
(As always, the atoms could be chosen by picking.) At this point a surface comprised of 5 points per square Å should appear over each oxygen. To create a more vivid surface, this value can be increased by multiples of five (ie 1 gives 5 dots per sq. Å, 2 gives 10 dots, etc.)
The Midas window should look something like this. Now one can monitor van der Waals clashes by looking for phi values that lead to overlap of the vdW surfaces. Do the points where the vdW surfaces intersect agree with the quantitative data obtained by monitoring the distances?
When finished, don't forget to quit Midas and to log out if no further work is to be performed.
1. G. N. Ramachandran and V. Sasiskharan (1968) Adv. Protein Chem. 23, 283-437.