NAMD 2.4b1 on ApoA1
92,224 atoms, 12A cutoff + PME every 4 steps, periodic
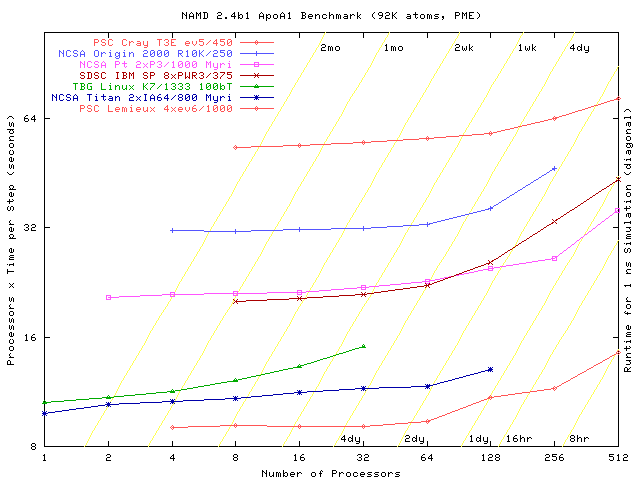
Time is in seconds per step, averaged over a number of steps,
after load balancing. NAMD prints this data, labeled Benchmark time,
twice near the beginning of a run. Due to its measurement-based load
balancing system, NAMD performance may improve dramatically after the first
couple of hundred timesteps.
Download this benchmark: config, directory, 2.8M archive
DHFR Common CHARMM/AMBER Benchmark
23,558 atoms, 9A cutoff + PME every step, periodic, Origin 2000 R10000/250
Time is in seconds per step, averaged over a number of steps,
after load balancing. NAMD prints this data, labeled Benchmark time,
twice near the beginning of a run. Due to its measurement-based load
balancing system, NAMD performance may improve dramatically after the first
couple of hundred timesteps.
The NCSA Origin was chosen for this benchmark because AMBER is installed
and available on the machine. The slower processors (250 MHz) and fast
interconnect on this machine should demonstrate best possible AMBER scaling.
|